
Perth.jl: Project Schedules You Can Compute On
What Perth.jl is, the concepts behind it (WBS, CPM, slack, critical path, PERT), how to install it, how it works under the hood, and a complete real-world example: the schedule of a service-times study, from the REPL to the browser.
https://morrisonkuhlsen.com/perth-jl-project-schedules/
Anyone who has ever coordinated a project — a research study, a construction site, a thesis with a defense date — has lived the same moment: someone asks “if this step slips two days, what else moves?”, and answering means redrawing the schedule by hand.
The problem is not the question. It is that the schedule has become a picture. A spreadsheet with colored bars, or a PNG exported from some tool, is great for presenting and useless for computing. Nobody can ask an image which task is the bottleneck, how much slack is left, or what the probability is of delivering before the 30th.
This post introduces Perth.jl, a Julia package I wrote precisely to treat a schedule as what it actually is: a data structure you can compute on. We’ll go through the concept, the installation, how it works under the hood, and finally a real example from start to finish.
1. What Perth.jl is
Perth.jl is a critical-path (CPM) engine in Julia with a local browser UI attached. The sentence that sums up the project: the model and the computation live in Julia; the browser is one view of the plan, not the source of truth.
In practice that means three things:
- You build the plan in code. Tasks, dependencies, assignees, deadlines — all with ordinary Julia functions, versionable in git like any other script.
- You ask the plan questions.
schedule!,critical_path,slack,workloadandpert_finishreturn Tables.jl-compatible rows — which means they drop straight into aDataFrame, a CSV, a plot. - You (and your team) edit in the browser.
Perth.run()starts a local server in the spirit of Pluto.jl: dragging a bar in the Gantt changes the object in the REPL, and changing the object in the REPL reloads the browser. Same data, live, on both sides.
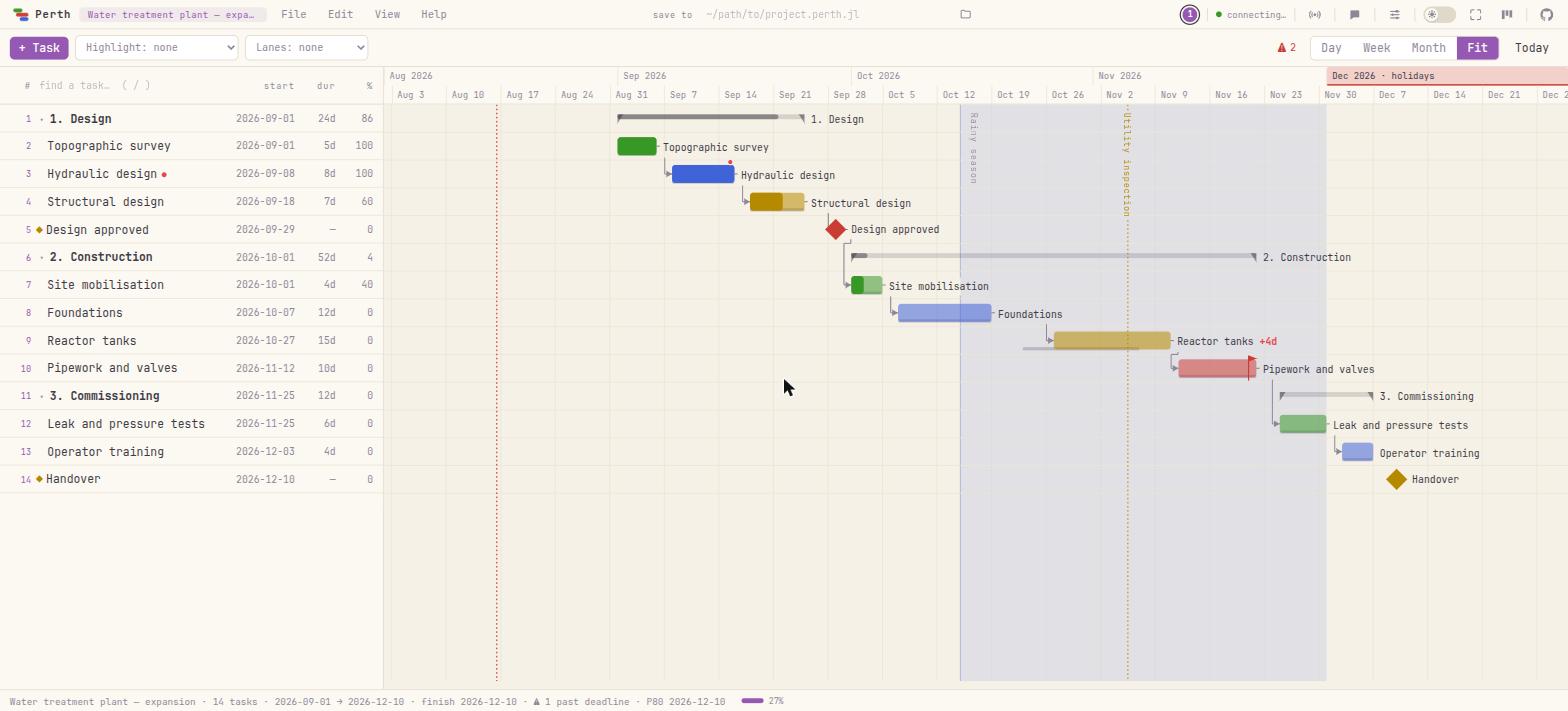
The package is MIT-licensed, requires Julia ≥ 1.10, and has no front-end build step: no node_modules, no framework. The browser gets plain HTML, CSS and JavaScript served by Julia itself.
2. The concepts behind it
The vocabulary is worth a few paragraphs, because it is what gives meaning to every function in the API. If you already know CPM, skip to section 3.
2.1 Tasks, WBS and rollup
The unit is the task: a name, a start date, a duration, optionally an assignee, a cost, an effort and a percentage complete. Tasks nest through the parent field, forming the WBS (Work Breakdown Structure).
A task with children becomes a summary: its dates and duration stop being typed in and start being computed from the children. That is why, in the example below, the phase “1. Collection and preparation” is created with duration = 1 and ends up 28 days long — nobody typed 28.
2.2 Dependencies: four ways of saying “after”
The default dependency is finish-to-start: task B starts once A finishes. Real life needs more nuance, and Perth accepts the classical variants inside the identifier string itself:
dependencies = [a.id]           # finish-to-start: b starts after a finishes
dependencies = ["$(a.id)+3"]    # finish-to-start with 3 days of lag
dependencies = ["SS:$(a.id)"]   # start-to-start: b starts when a starts
dependencies = ["SS:$(a.id)+2"] # start-to-start with 2 days of lag
dependencies = ["FF:$(a.id)"]   # finish-to-finish: b cannot finish before a does
The lag is the number after the +. Start-to-start with lag is especially useful for work that accompanies other work: fitting a model can start two days after the descriptive analysis started, without waiting for it to end.
2.3 CPM: the two passes
schedule!(p) runs the Critical Path Method — two sweeps over the dependency graph.
The forward pass pushes each task to the earliest it can happen:
\[ES_j = \max_{i \to j} \left( EF_i \right) + 1, \qquad EF_j = ES_j + d_j - 1\]The backward pass, starting from the end of the project, computes the latest each task can happen without delaying the whole:
\[LF_i = \min_{i \to j} \left( LS_j \right) - 1, \qquad LS_i = LF_i - d_i + 1\]The difference between the two is the slack:
\[\text{slack}_i = LS_i - ES_i\]Tasks with zero slack cannot slip a single day without pushing the delivery: they are the critical path. This is exactly the information a picture of a schedule never gives you for free.
One important detail about Perth: schedule! only ever pushes tasks forward, never pulls them back. The date you typed acts as a start-no-earlier-than constraint. That keeps the engine from inventing a plan that starts earlier than reality allows.
2.4 A deadline is not a date
Here is the design decision that changes the experience most. There are two kinds of commitment, and Perth treats each one differently:
deadline— a promise made to someone outside (the conference submission, the client delivery). It never moves a task. What it does is cap the backward pass: if the plan does not fit, the slack of that task and of everything feeding it goes negative. The delay shows up as a number instead of disappearing into a dragged bar.pinned— a contracted date that is no longer negotiable (the meeting already booked, the field-collection day).schedule!leaves it alone; if the rest of the plan no longer fits from there, that shows up as anearly_startlater than the task’s own start.
2.5 Business days
With BusinessDays.jl loaded, set_calendar!(p, "Brazil") makes the engine count durations in business days, national holidays included. A five-day task starting on a Thursday ends the following Wednesday, and November 2nd does not count.
2.6 Resources: capacity and effort
Each person can declare a capacity — how much work they absorb in one business day — and each task an effort, in the same unit. With both numbers, workload(p) returns the daily load per person and overallocations(p) points at the days where someone was booked beyond what fits. level!(p) goes further and reschedules: it pushes whatever has slack until nobody is over capacity, starting with whoever has the most slack — so the critical path and anything with a deadline are the last to give way.
2.7 PERT: when the duration is a guess
Durations are almost always estimates. PERT formalizes that by asking for three numbers per task — optimistic $o$, most likely $m$, pessimistic $p$ — and summarizing them into an expected duration and a standard deviation:
\[t_e = \frac{o + 4m + p}{6}, \qquad \sigma = \frac{p - o}{6}\]Variance accumulates along the critical path, and the project finish becomes a distribution rather than a date:
\[\sigma_{\text{project}} = \sqrt{\sum_{i \,\in\, \text{critical}} \sigma_i^2}, \qquad P(\text{finish} \le D) = \Phi\!\left( \frac{D - E}{\sigma_{\text{project}}} \right)\]Perth implements the classical formula (pert_finish, finish_probability, pert_date) and also a Monte Carlo simulation (pert_simulate) that samples durations for every estimated task and re-runs the CPM thousands of times. The gap between the two answers is instructive, and we’ll watch it appear in the example.
3. Installation
The package is in the General registry, so:
using Pkg
Pkg.add("Perth")
Three dependencies are optional and auto-detected — the package works without them and gains features with them:
| Package | What it enables |
|---|---|
BusinessDays |
business-day calendars (set_calendar!(p, "Brazil")) |
CairoMakie |
static Gantt figures (ganttplot, save_chart) |
QRCoders |
a QR code for the link when you share over the LAN |
Pkg.add(["BusinessDays", "CairoMakie", "QRCoders"])To open the interface:
using Perth

Perth.run()          # opens http://localhost:8123 in your browser
And a minimal plan, just to get a feel for the API:
using Perth

p = create_project("My first plan")

a = add_task!(p, "Write the script"; start = Date(2026, 9, 1), duration = 5, assignee = "Ana")
b = add_task!(p, "Record";           duration = 3, dependencies = [a.id], assignee = "Bruno")
c = add_task!(p, "Edit";             duration = 4, dependencies = [b.id], assignee = "Bruno")

schedule!(p)
project_finish(p)
4. How it works under the hood
The architecture fits in one drawing:
REPL  ──►  AppState (in memory + revision counter)  ◄──  HTTP API
             │                                                 ▲
             ▼                                                 │
      JSON in ~/.perth                                Browser (vanilla JS/CSS)
      .perth.jl mirror                                presence over WebSocket
The project state lives in memory, in an AppState with a revision counter. The REPL writes to it by calling the API functions; the browser writes to it over HTTP. The revision counter is what lets the browser notice that something changed on the other side and reload — while the WebSocket carries presence (the cursors of everyone else looking at the plan).
On disk, each project is a JSON file in ~/.perth/ (override with the PERTH_DATA_DIR variable or with Perth.run(data_dir = ...)). Alongside it there is the .perth.jl format: the plan written as readable Julia code, designed to live in git and produce diffs a human can actually read:
Perth.save(p, "plans/study.perth.jl")     # readable text, versionable in git
q = Perth.load("plans/study.perth.jl")    # restricted parser, no eval

set_file_path!(p, "plans/study.perth.jl") # automatic mirror on every change
The .perth.jl reader is restricted: it accepts only the package’s own constructors (Project, GanttTask, Person, Date and a few others) and does not use eval. Opening a colleague’s file does not execute their code.
And since every query function returns Tables.jl rows, the plan talks to the rest of the ecosystem without an adapter:
using CSV, DataFrames

CSV.write("tasks.csv", DataFrame(tasktable(p)))
write("submission.ics", icalendar(p))      # milestones and deadlines in your calendar
5. A real example: a service-times study
Now for the concrete case. An emergency department has approved a study of service times: extract the records from the system, describe the times, fit an M/M/c queueing model, simulate staffing scenarios and write the paper. The team has three people. There is one external commitment: the conference submission on October 30th, 2026.
The question the schedule has to answer is not “how does this look on a slide”. It is: can we make it?
5.1 The plan
We start with the project, the calendar and the team. Capacities are in hours per business day, and the task efforts will use the same unit:
using BusinessDays, Perth

first_day = Date(2026, 9, 1)
p = create_project("Service times study — Emergency department")
set_calendar!(p, "Brazil")          # durations are now counted in business days

people!(p, [
    (name = "Ana",   role = "Coordinator",  team = "Research", capacity = 8),
    (name = "Bruno", role = "Analyst",      team = "Data",     capacity = 8),
    (name = "Clara", role = "Statistician", team = "Research", capacity = 8),
])
The first phase — collection and preparation. Note that every task is created on first_day: it is the schedule! at the end that spreads them out along the dependencies.
f1 = add_task!(p, "1. Collection and preparation"; start = first_day)

ethics = add_task!(p, "Protocol and ethics committee approval";
    start = first_day, duration = 10, assignee = "Ana", parent = f1.id, effort = 20)

extract = add_task!(p, "Extract records from the system";
    start = first_day, duration = 3, assignee = "Bruno", parent = f1.id,
    dependencies = [ethics.id], effort = 18)

clean = add_task!(p, "Clean and consistency-check the data";
    start = first_day, duration = 5, assignee = "Bruno", parent = f1.id,
    dependencies = [extract.id], effort = 30)

dataset = add_task!(p, "Dataset ready";
    start = first_day, milestone = true, parent = f1.id, dependencies = [clean.id])
The second phase. Here the start-to-start link with lag shows up: fitting the model starts two days after the descriptive analysis started, because the two feed each other. And the literature review is a parallel branch that only has to be ready in time for the writing:
f2 = add_task!(p, "2. Analysis"; start = first_day)

descriptive = add_task!(p, "Descriptive analysis of service times";
    start = first_day, duration = 4, assignee = "Clara", parent = f2.id,
    dependencies = [dataset.id], effort = 24)

model = add_task!(p, "Fit the M/M/c queueing model";
    start = first_day, duration = 6, assignee = "Clara", parent = f2.id,
    dependencies = ["SS:$(descriptive.id)+2"], effort = 42)

simulation = add_task!(p, "Simulate staffing scenarios";
    start = first_day, duration = 5, assignee = "Bruno", parent = f2.id,
    dependencies = [model.id], effort = 30)

literature = add_task!(p, "Literature review";
    start = first_day, duration = 6, assignee = "Ana", parent = f2.id,
    dependencies = [dataset.id], effort = 18)
The third phase, with the conference deadline attached to the final milestone:
f3 = add_task!(p, "3. Communication"; start = first_day)

writing = add_task!(p, "Write the paper";
    start = first_day, duration = 8, assignee = "Ana", parent = f3.id,
    dependencies = [descriptive.id, simulation.id, literature.id], effort = 48)

review = add_task!(p, "Internal review";
    start = first_day, duration = 3, assignee = "Clara", parent = f3.id,
    dependencies = [writing.id], effort = 15)

submission = add_task!(p, "Conference submission";
    start = first_day, milestone = true, parent = f3.id,
    dependencies = [review.id], deadline = Date(2026, 10, 30))

schedule!(p)
5.2 The first question
project_finish(p)2026-11-04The plan finishes on November 4th. The conference closes on October 30th. We already have a problem — and, more importantly, we have a measured problem.
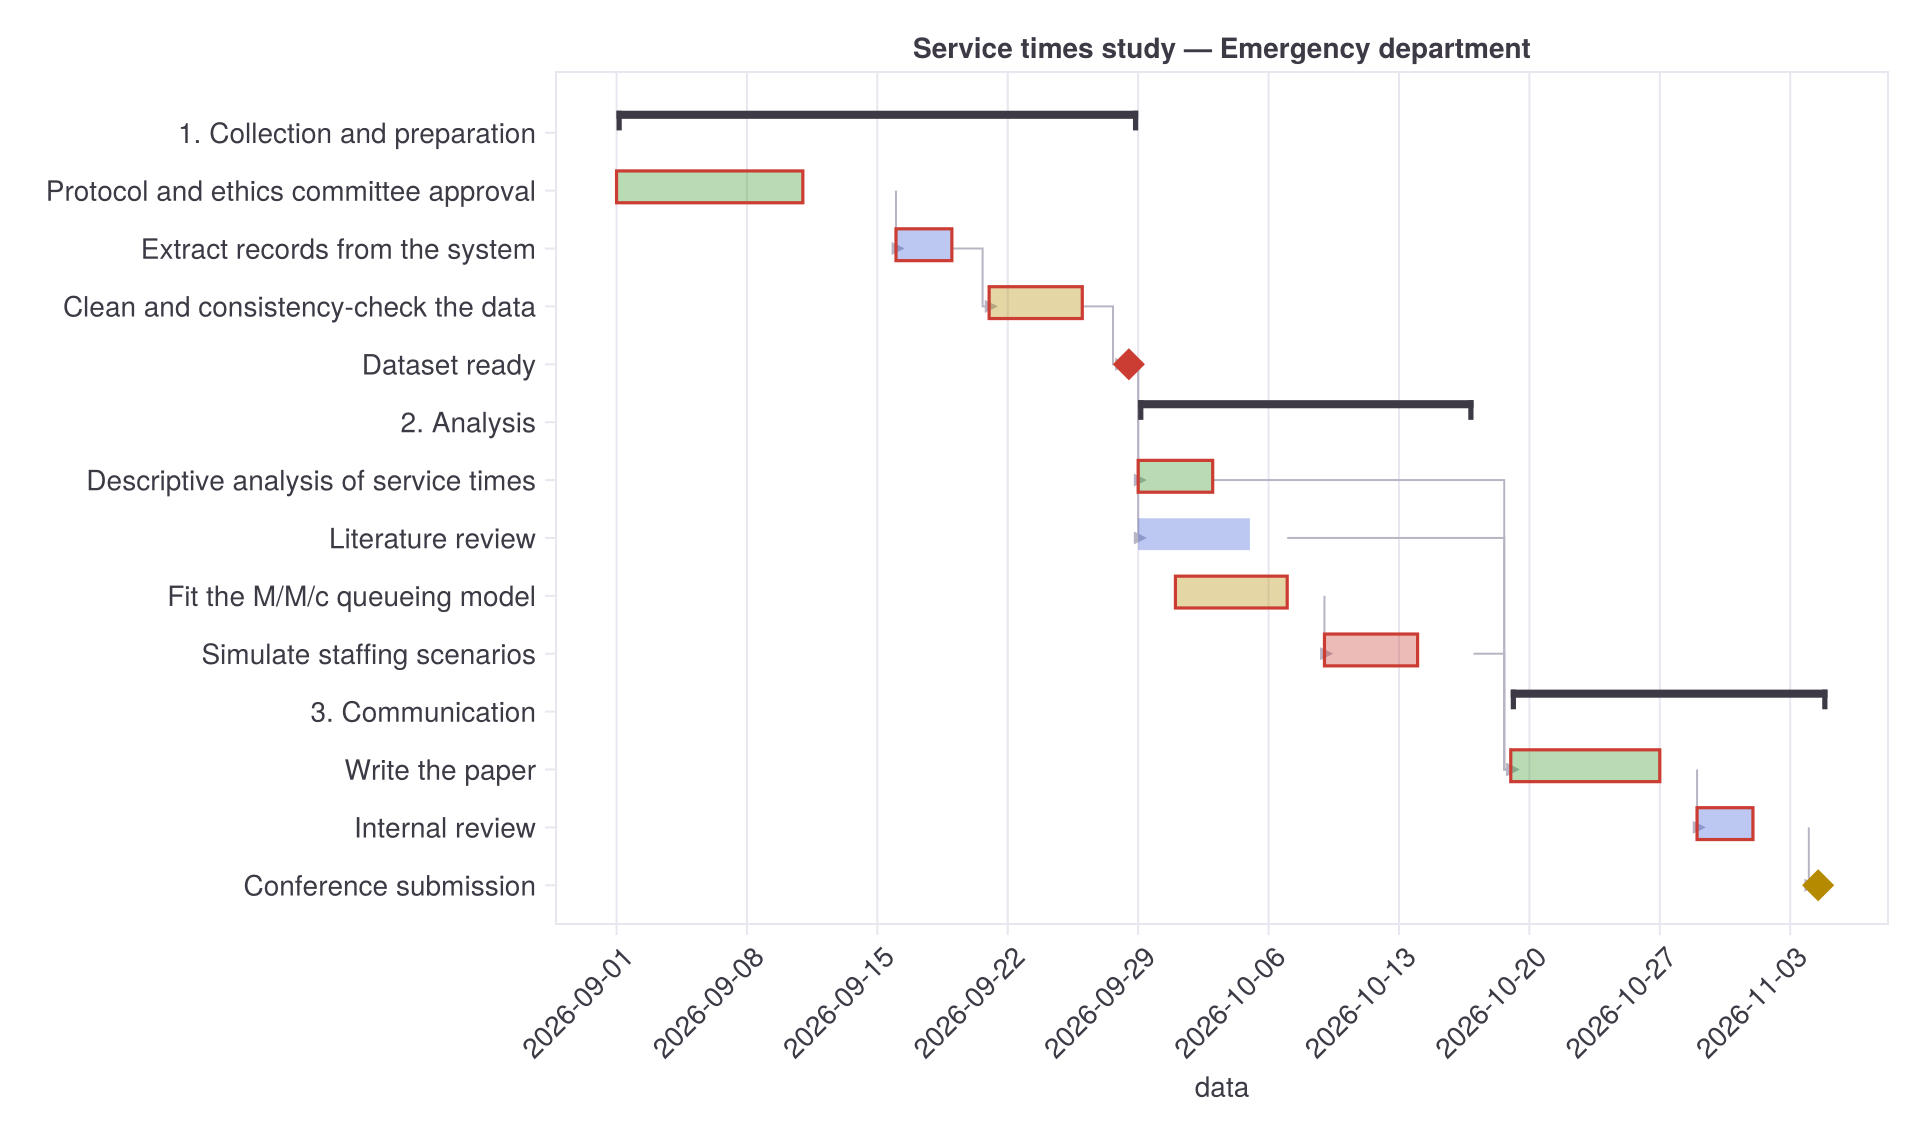
save_chart(p, "gantt-study.png"), through CairoMakie. Bars outlined in red are on the critical path; the only one without an outline is the literature review.
5.3 Where the slack is
using DataFrames

DataFrame(slack(p))| Task | Early start | Early finish | Slack | Critical | Bottleneck |
|---|---|---|---|---|---|
| Protocol and ethics committee approval | 2026-09-01 | 2026-09-15 | −2 | yes | no |
| Extract records from the system | 2026-09-16 | 2026-09-18 | −2 | yes | no |
| Clean and consistency-check the data | 2026-09-21 | 2026-09-25 | −2 | yes | no |
| Dataset ready | 2026-09-28 | 2026-09-28 | −2 | yes | yes |
| Descriptive analysis of service times | 2026-09-29 | 2026-10-02 | −2 | yes | yes |
| Literature review | 2026-09-29 | 2026-10-06 | 5 | no | no |
| Fit the M/M/c queueing model | 2026-10-01 | 2026-10-08 | −2 | yes | no |
| Simulate staffing scenarios | 2026-10-09 | 2026-10-16 | −2 | yes | no |
| Write the paper | 2026-10-19 | 2026-10-28 | −2 | yes | no |
| Internal review | 2026-10-29 | 2026-11-03 | −2 | yes | no |
| Conference submission | 2026-11-04 | 2026-11-04 | −2 | yes | no |
Three readings of that table:
Negative slack is the deadline talking. No task was moved because of the deadline — the plan is exactly the same one. What changed is that the backward pass now has a ceiling: October 30th. The entire chain feeding the submission is two business days late, and the number shows up on every row, not just the last one.
Exactly one task has slack. The literature review can slip five business days with no consequence at all. It is the only thing in the plan that can be deprioritized for free — and that was not obvious from looking at the Gantt.
The bottleneck has a name. The bottleneck column flags critical tasks that more than one other task depends on. “Dataset ready” and “Descriptive analysis” are the two points where a delay propagates down two paths instead of one. Those are the places to watch before something happens.
And the delay, in calendar days:
deadline_slip(p)1-element Vector{NamedTuple}:
(id = "93a7d306", name = "Conference submission", deadline = Date("2026-10-30"),
finish = Date("2026-11-04"), slip_days = 5)Note the difference between the two numbers: slack is −2 business days and the slip is 5 calendar days. There is no contradiction — between October 30th (a Friday) and November 4th there are five calendar days but only two working ones, because November 2nd is a holiday. CPM slack is measured in the project’s calendar; the slip, in the calendar of real life.
5.4 Who is overloaded
overallocations(p)1-element Vector{NamedTuple}:
(assignee = "Clara",
task1 = "026b2caf", task1_name = "Descriptive analysis of service times",
task2 = "4b5172e8", task2_name = "Fit the M/M/c queueing model",
from = Date("2026-10-01"), to = Date("2026-10-02"))filter(r -> r.assignee == "Clara", workload(p)) |> DataFrame assignee date tasks effort capacity over
Clara 2026-09-29 1 6.0 8.0 false
Clara 2026-09-30 1 6.0 8.0 false
Clara 2026-10-01 2 13.0 8.0 true
Clara 2026-10-02 2 13.0 8.0 true
Clara 2026-10-05 1 7.0 8.0 false
...Clara’s capacity is 8 hours per business day. On October 1st and 2nd, the descriptive analysis (6 h/day) and the model fitting (7 h/day) overlap: 13 hours in an 8-hour day. We created that overlap ourselves when we wrote "SS:$(descriptive.id)+2" — the start-to-start link is convenient for the schedule and uncomfortable for whoever does the work. The plan looked reasonable; the arithmetic does not add up.
5.5 What if the duration is a guess?
So far we have treated durations as facts. They are not. “Ethics committee approval in 10 days” is institutionalized optimism, and “extract the records in 3 days” depends on an IT department nobody controls. Let’s declare the three points:
set_estimate!(p, ethics.id,   8, 10, 20)   # optimistic, most likely, pessimistic
set_estimate!(p, extract.id,  2,  3, 10)
set_estimate!(p, model.id,    4,  6, 14)
set_estimate!(p, writing.id,  5,  8, 15)

schedule!(p)
pert(p) |> DataFrame| Task | $o$ | $m$ | $p$ | $t_e$ | $\sigma$ | Duration in plan |
|---|---|---|---|---|---|---|
| Protocol and ethics committee approval | 8 | 10 | 20 | 11.33 | 2.00 | 11 |
| Extract records from the system | 2 | 3 | 10 | 4.00 | 1.33 | 4 |
| Fit the M/M/c queueing model | 4 | 6 | 14 | 7.00 | 1.67 | 7 |
| Write the paper | 5 | 8 | 15 | 8.67 | 1.67 | 9 |
By default set_estimate! already applies the expected duration to the plan (pass apply = false to record the estimate without touching it). And that alone delivers a message: the original plan was optimistic on every estimated task. The pessimistic tails are long enough to pull each $t_e$ above the “most likely” value we had typed.
pert_finish(p)(expected = Date("2026-11-10"), sd_days = 3.3665, variance = 11.333,
critical = 10, estimated = 4)The expected finish slid from November 4th to November 10th, with a standard deviation of 3.4 days. Now we can ask the question that matters:
finish_probability(p, Date(2026, 10, 30))   # the date we promised
finish_probability(p, Date(2026, 11, 20))
pert_date(p, 0.8) # the date we can actually promise0.0005
0.9985
2026-11-13The probability of meeting the October 30th deadline is 0.05%. That is not “hard”: that is no. And the date we can promise with 80% confidence is November 13th — two weeks past what was agreed. That is the number to bring to the advisor or the client, because it is not an opinion about somebody’s optimism.
It is also worth comparing the formula against the simulation:
sim = pert_simulate(p; n = 10_000)

(sim.p10, sim.p50, sim.p80, sim.p90)(Date("2026-11-10"), Date("2026-11-11"), Date("2026-11-16"), Date("2026-11-17"))The classical formula puts P80 on November 13th; Monte Carlo puts it on November 16th. The difference has a name: merge bias. The formula propagates variance only along today’s critical path; the simulation samples every path, and a parallel branch with little slack and a wide estimate has a real chance of becoming critical. Whenever there are near-critical paths, the formula is optimistic — and the size of that gap is a direct measure of how much the plan depends on everything going right in parallel.
5.6 What changes if that slips?
The question from the top of the post, now answered in two lines:
update_task!(p, extract.id; duration = 8)   # the extraction got stuck in IT
schedule!(p)

project_finish(p)
deadline_slip(p)2026-11-16
1-element Vector{NamedTuple}:
(id = "93a7d306", name = "Conference submission", deadline = Date("2026-10-30"),
finish = Date("2026-11-16"), slip_days = 17)The extraction going from 3 to 8 days pushes the submission to November 16th: 17 days late against the deadline. update_task! walked the whole chain without anyone redrawing anything.
This is where Perth stops being a Gantt drawer. The schedule answers because it is data, not a picture.
5.7 Taking the plan to the team
With the plan settled, Perth.run() opens the same thing in the browser — and if the team is on the same network, you can share it:
Perth.run(share = true)         # publish the Gantt on the LAN, with a QR code
Perth.key!("study-2026")        # require an access key to edit
Perth.view_key!("study-2026-v") # read-only link, the one you hand to your advisor
Perth.share!(false)             # stop broadcasting without restarting the server
Every connected machine appears as a cursor labelled with its name and IP, pair-programming style, and there is a built-in chat. You can also turn the plan into a Kanban board:
kanban_from_project!(p)         # every task in the plan becomes a card
Perth.kanban(share = true)      # collaborative board on the local network
Cards created from the plan stay linked to the task they came from: dragging a card to done completes the corresponding Gantt task, live.
And the figure from section 5.2 takes two lines:
using CairoMakie

save_chart(p, "gantt-study.png")
6. What Perth.jl is not
Being honest about the limits saves frustration:
- It is not multi-user by identity. Access control is by network and by key, not by login. Two people editing the same field resolve as last write wins.
- It should not be exposed to the internet. It is a LAN tool, for a room of people who already trust each other. Do not put port 8123 on a public IP.
- It does not level resources automatically.
level!exists and is a defensible heuristic (least slack first), but levelling is NP-hard: the result is good, not optimal. - It does not replace MS Project or Primavera in organizations that need corporate governance, multiple calendars per resource and a formal audit trail. The target is different: people already working in Julia who want the schedule to be one more object in the workspace.
7. Where to go next
Perth.jl is in the General registry (] add Perth), and the code, the commented examples and the changelog live in the repository:
- Repository: github.com/dantebertuzzi/Perth.jl
- Announcement and discussion: the Julia Discourse thread
- Package: Perth on JuliaHub
Suggestions, questions and reports from real use are very welcome — open an issue on the repository or leave a comment below.



Comments